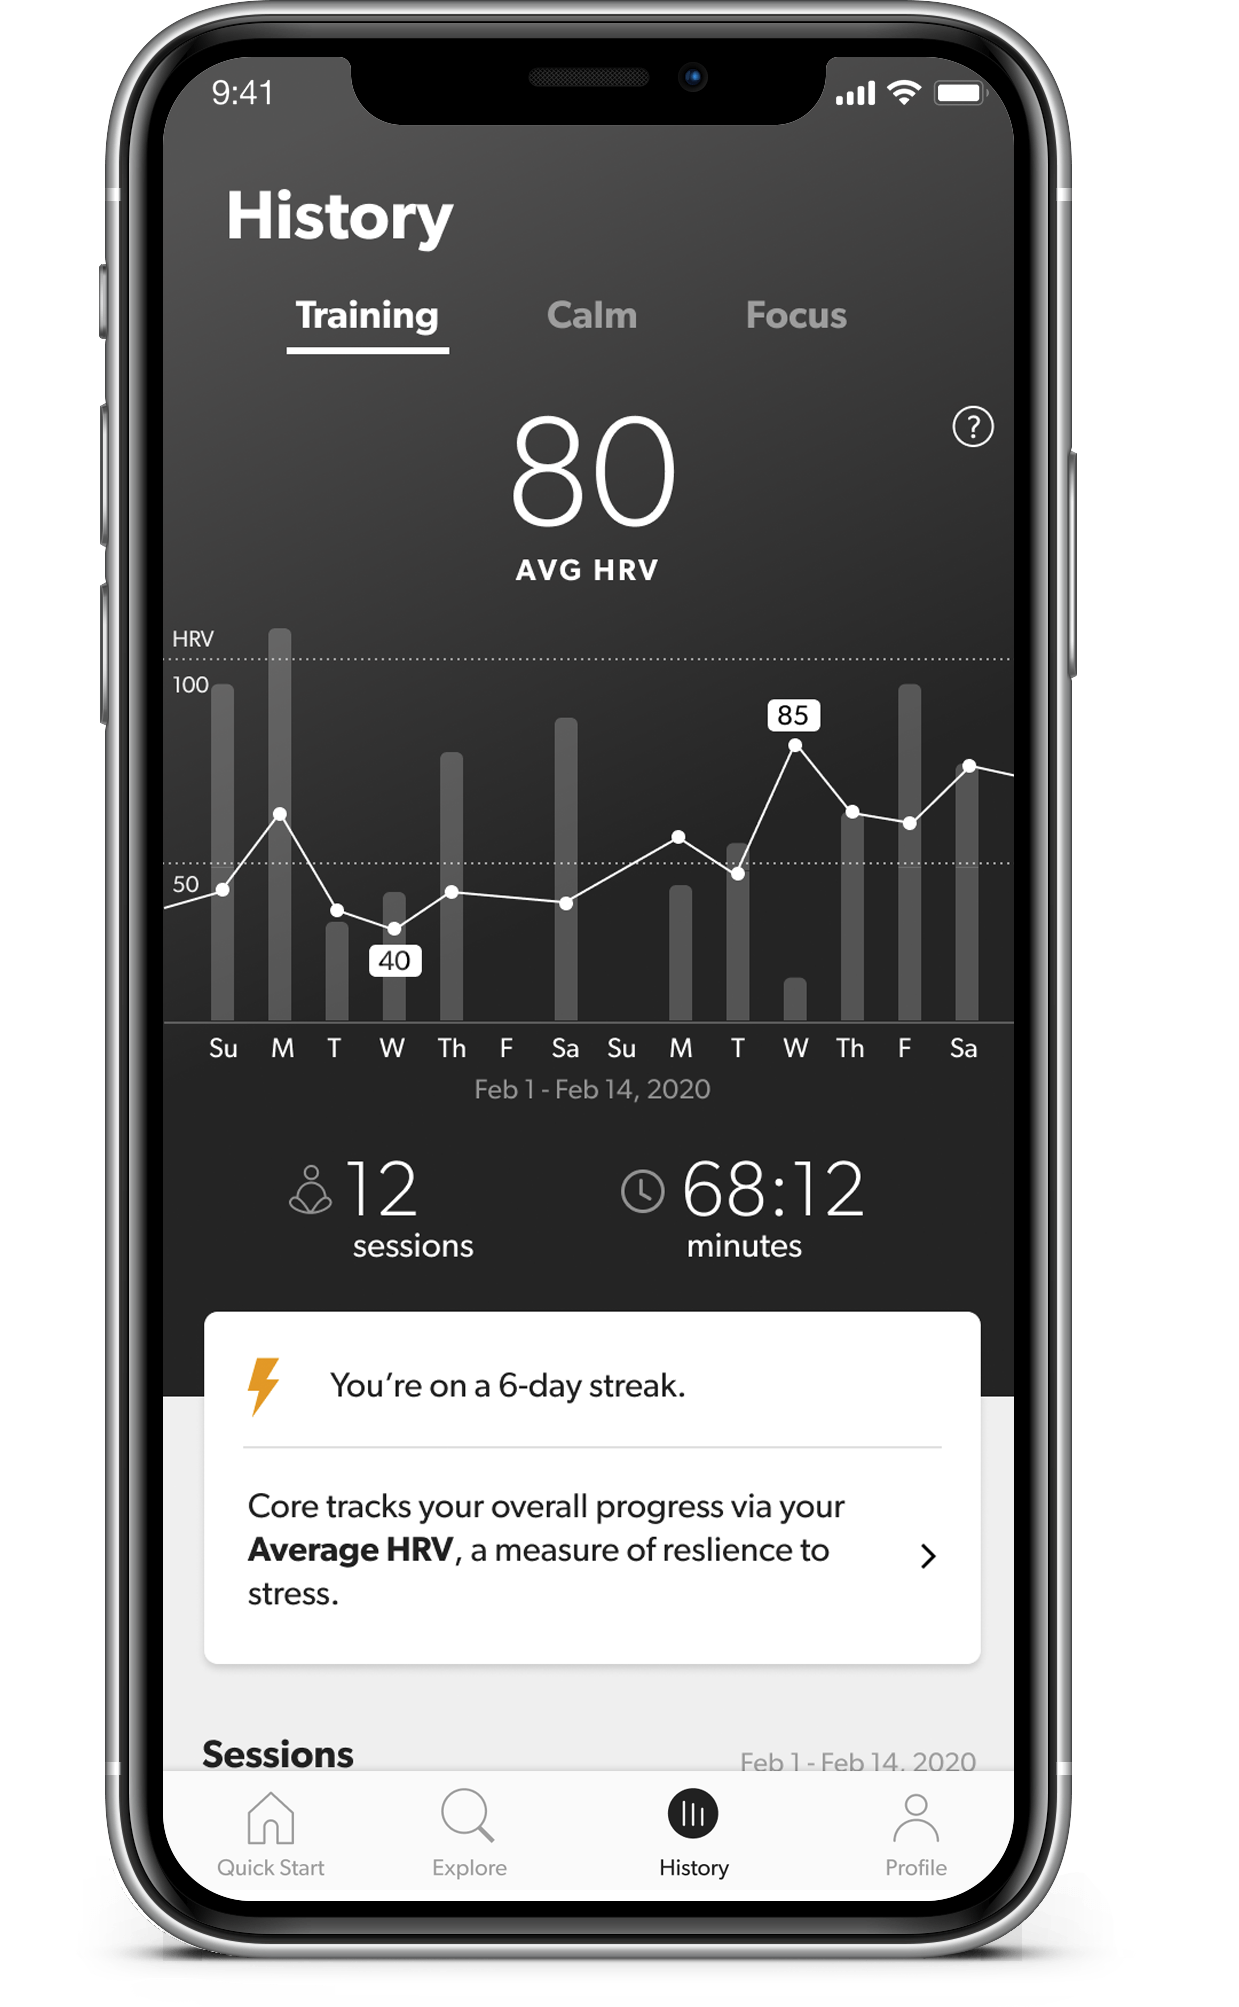
The History tab shows you the results from all your previous sessions, and summarizes the trends in your biometrics over time.
You can swipe left and right on the graph to move backwards and forwards in time.
Consistency is the key when it comes to training your brain and body to respond to meditation. This tab will let you know if you’re currently on a multi-day or multi-week streak — keep it up!
|
|
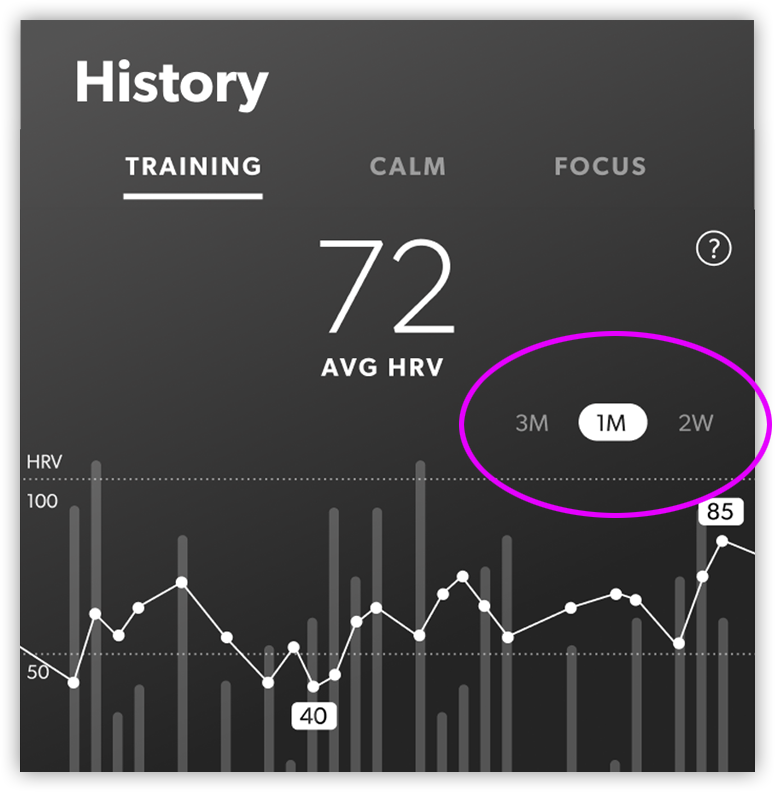
The graph can be toggled between three different durations: you can view your data from the previous 2 weeks, 1 month, or 3 months. Above and below the graph, you’ll see summary statistics for the chosen time period. |
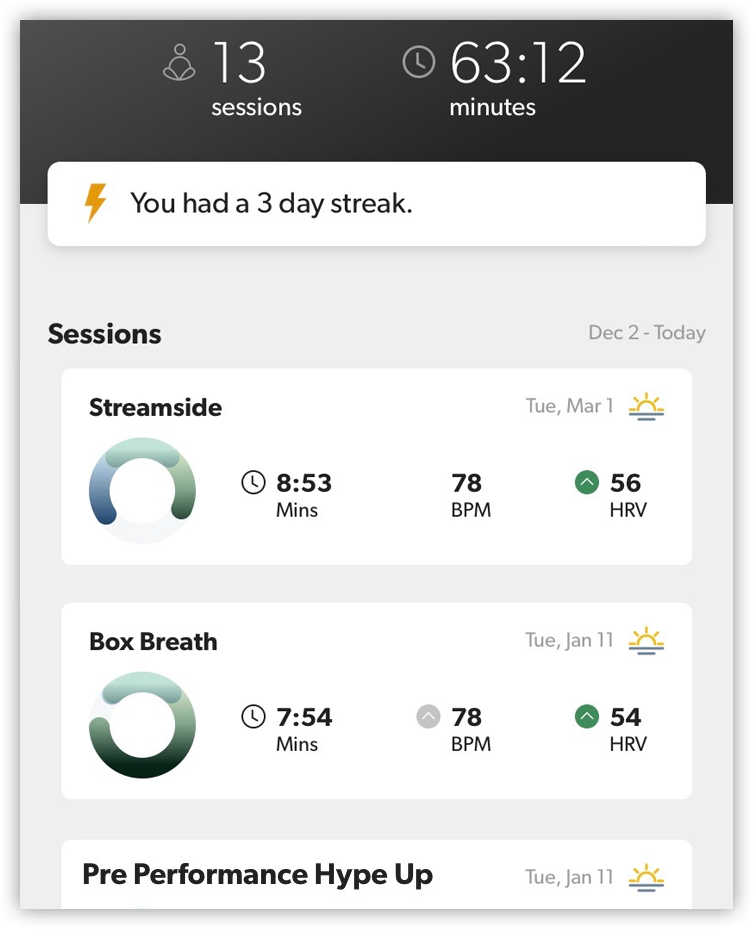 |
At the bottom of the screen, you’ll see a list of all the sessions you did in the timeframe you’re currently viewing. You can tap on any of these sessions to see your detailed results, or modify your Reflection entry. |
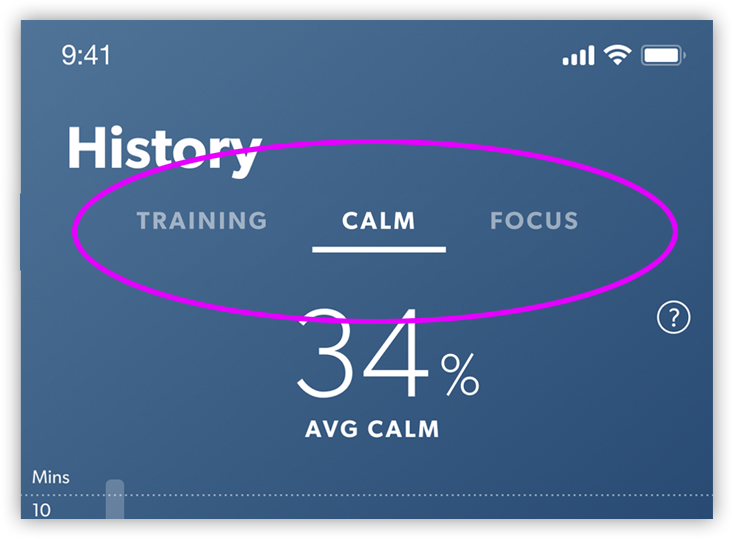 |
The top of the History graph is separated into three tabs. The Training tab is focused on how much time you’ve spent meditating, and the overall trends in your Heart Rate Variability (HRV) — one of the most important biometric measurements that Core uses. You can learn more about it in this article. When you change to the Calm or Focus tab, you’ll see how much of your meditation sessions were spent in a calm or focused state. You’ll also see the percentage of time you spent in that state, averaged across all the meditations in the current timeframe. Learn more about how Core calculates Calm and Focus in this article. |
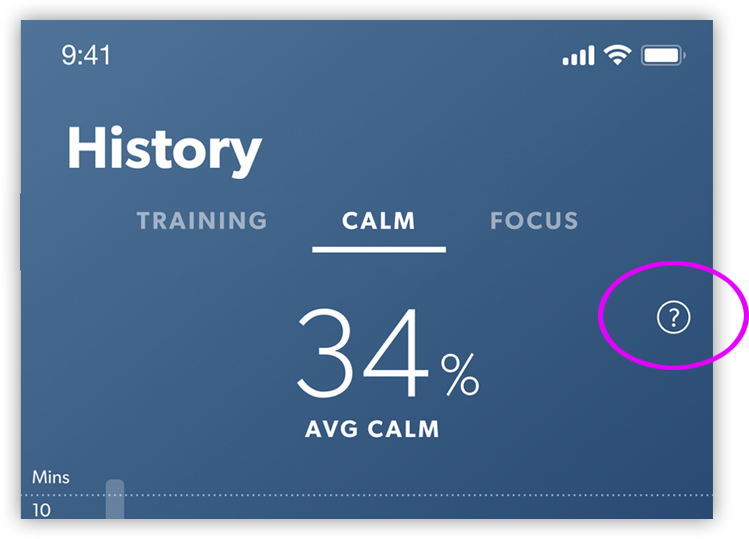 |
You can also read more about Core’s primary metrics, and what they mean, by tapping the little “?” icon at the top of the screen. |