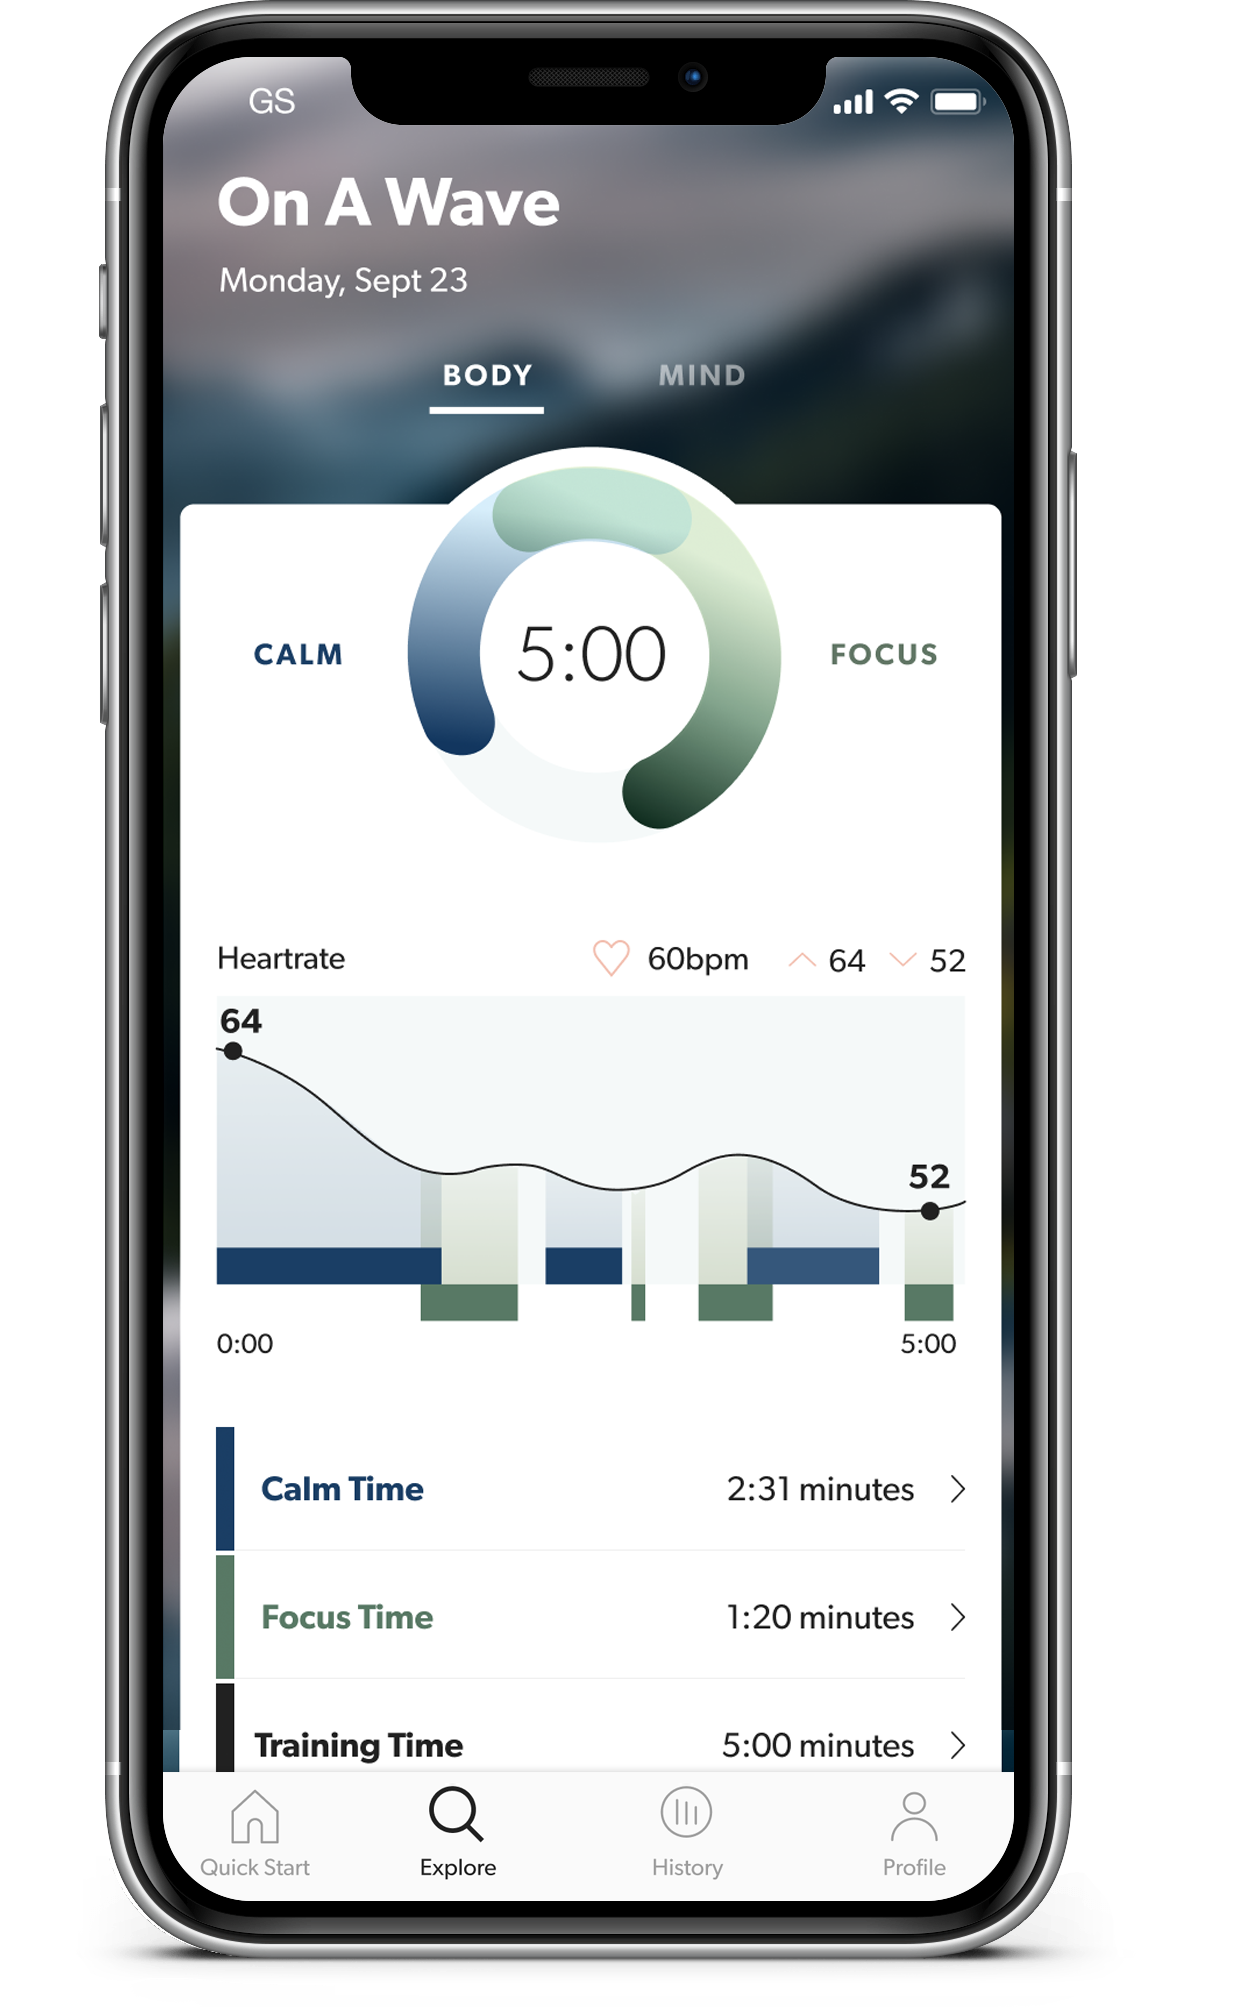
Each time you complete a meditation, you’ll be presented with a few different charts and graphs that show you how your body reacted during the session. This data is based on changes in your heart rate patterns, as measured by the ECG sensors on the top of the Core device.
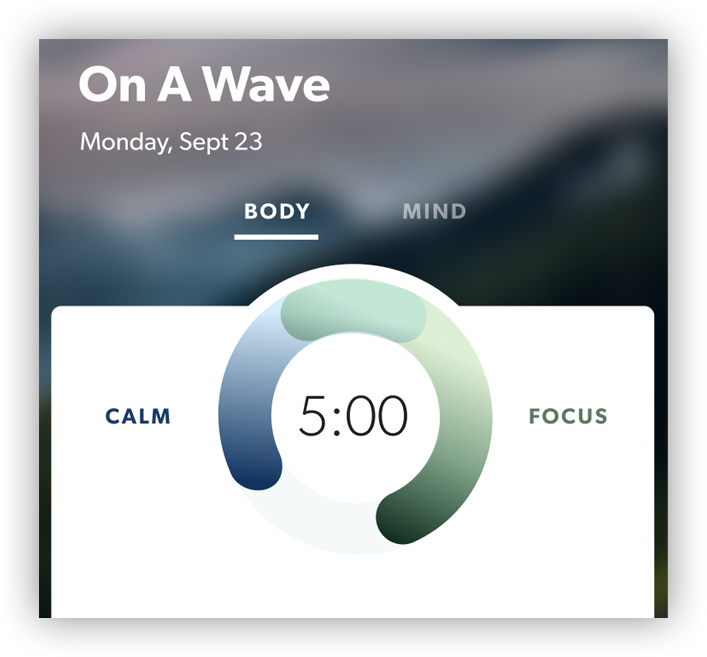 |
At the top of your results, you’ll see a donut chart of how much time you spent meditating (Training), and the proportion of that time that you were in a state of Calm, and a state of Focus. The blue ring represents your Calm time, while the green ring represents Focus. You can experience Calm and Focus at the same time — when this happens, you’ll see the two rings overlap one another. To learn more about what Calm and Focus mean, and the physiological processes they’re connected to, check out this article.
|
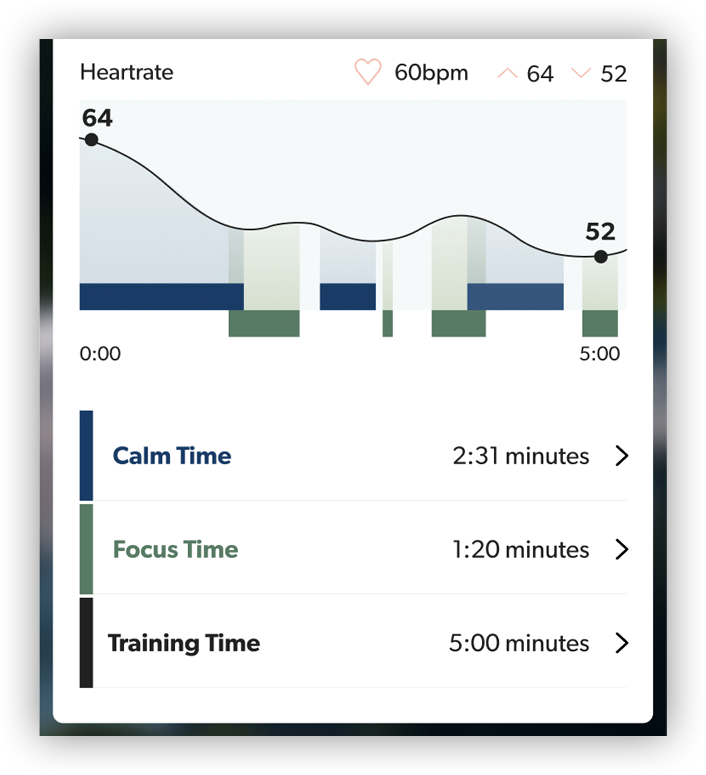 |
Directly below that, you’ll see a more detailed graph that shows you exactly what changed over the duration of the meditation. The line on this graph is your heart rate, so you can see how your pulse increased and decreased over time. Beneath that, the blue and green bars indicate the exact times that your body was in a state of Calm or Focus. Occasionally, there might be some gaps in this graph. This happens when Core can’t get a good measurement of your heartbeat, and can be caused by a few different things. If you’re running into this problem consistently, learn more about how to troubleshoot it in this article.
|
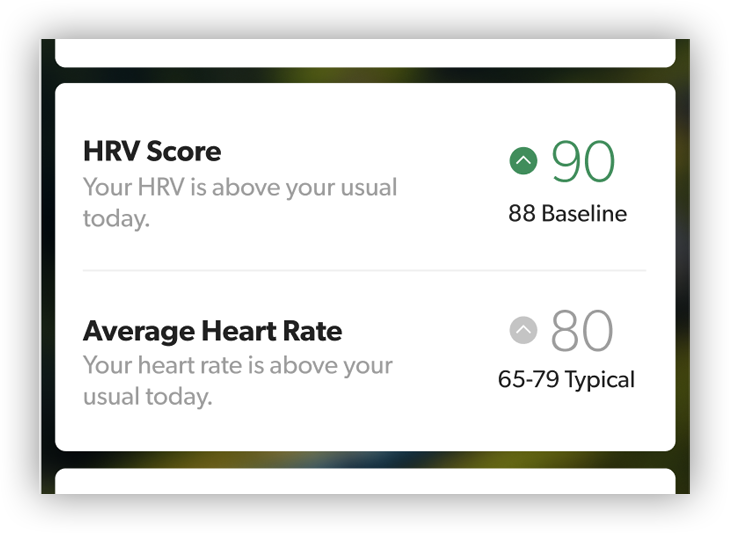 |
At the bottom, you’ll see some summary statistics about your heart rate, including your average heart rate during the session. Next to that, you can see whether you were above or below your typical baseline. Finally, you’ll see a similar score for your Heart Rate Variability (HRV), and how it compared to your baseline. HRV is a key component of how Core calculates your Calm and Focus scores. Your baseline scores are personalized and dynamic — they may change slightly as time goes on, as Core has more time to analyze your typical heart rate patterns. |
If you complete a meditation and find that your HRV is considerably lower than normal, this can be a sign of physical stress — it might be a good time to take a little extra self-care, give yourself some extra recovery time, or get a bit more sleep.
Remember that everyone’s physiology is different, so your absolute HRV score matters much less than whether you are above or below your typical HRV score. This is why Core calculates personalized baselines for you, rather than comparing you to population averages. Pay attention to whether your score is trending up or down (the History tab is especially good for this), as this could give you some insight as to whether you’re experiencing more stress than usual.